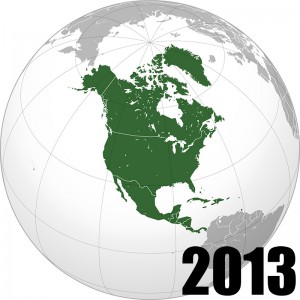
North America Population 2013
North America’s population in 2013 is currently calculated based on national estimations at 529,000,000 people. North America is a continent wholly within the Northern Hemisphere and almost wholly within the Western Hemisphere. It is also considered a northern subcontinent of the Americas. It is bordered to the north by the Arctic Ocean, to the east by the Atlantic Ocean, to the west and south by the Pacific Ocean, and to the southeast by South America and the Caribbean Sea.
The first people to live in North America were Paleoindians who began to arrive during the last glacial period by crossing the Bering land bridge. They differentiated into a number of diverse cultures and communities across the continent. The largest and most advanced Pre-Columbian civilizations in North America were the Aztecs in what is now Mexico and the Mayans in Central America. European colonists began to arrive starting in the 16th and 17th centuries, wiping out large numbers of the native populations and beginning an era of European dominance.
North America Land Mass
North America covers an area of about 24,709,000 square kilometers (9,540,000 square miles), about 4.8% of the planet’s surface or about 16.5% of its land area. As of July 2008, its population was estimated at nearly 529 million people across 23 independent states, representing about 7.5% of the human population. North America is the third-largest continent in area, following Asia and Africa, and the fourth in population after Asia, Africa, and Europe.
North America Languages
The languages of North America reflect not only that continent’s indigenous peoples, but the European colonization as well. The most widely spoken languages in North America are English, Spanish, and French.
North America is home to a large number of language families and some language isolates. In the Arctic north, the Eskimo–Aleut languages are spoken from Alaska to Greenland. This group includes the Aleut language of the Aleutian Islands, the Yupik languages of Alaska and the Russian Far East, and the Inuit languages of Alaska, Yukon, the Northwest Territories, Nunavut, and Greenland.
 North America Wildlife
North America is a land of varied landscapes that stretches from the Arctic in the north to the narrow landbridge of Central America in the south. The wildlife of North America, like its habitats, is diverse and includes animals such as bison, pronghorn, brown bears, bald eagles, hummingbirds, bullfrogs, snapping turtles, rattlesnakes, cougars, and American alligators.Deer are the most common animal in North America. Rabbits are also very common in North America. The turtle is the most common reptile. The most common animal in the United States is the Tree Squirrel. Dogs are the most popular pets in North America, followed by the domestic cat.
Top 5 North American Countries By Population
| Rank | Country | Population |
| 1 | United States | 316,094,000 |
| 2 | Mexico | 118,419,000 |
| 3 | Canada | 35,236,000 |
| 4 | Guatemala | 15,440,000 |
| 5 | Cuba | 11,163,000 |
Top 10 North American Cities By Population
| Rank | City | Population |
| 1 | Mexico City | 8,851,080 |
| 2 | New York City | 8,244,910 |
| 3 | Los Angeles | 3,819,702 |
| 4 | Toronto | 2,791,140 |
| 5 | Chicago | 2,707,120 |
| 6 | Houston | 2,145,146 |
| 7 | Havana | 2,141,993 |
| 8 | Montréal | 1,688,481 |
| 9 | Ecatepec de Morelos | 1,655,015 |
| 10 | Guadalajara | 1,564,514 |
North America Visual Population Data
Other Resources
To learn more about the population of North America, click here
Learn more about South America Population 2013.
Interactive World Population by Continent Map