Quebec Population
According to the estimates made using population census data and population growth information, the population of Quebec as of the year 2013 is 8,028,400.
Quebec’s population of 8,028,400 makes up approximately 23.6% of the Canadian national population. Due to the 4.7% population growth Quebec has seen over the past years, Quebec is the second most populated province in Canada. Ontario is the most populated province with 13.5 million people and British Columbia with 4.6 million inhabitants is the next most populated province after Quebec.
Quebec is unique in that it’s inhabitants predominantly speak the French language and Fresh is the province’s sole official language.
Quebec Land Area
While the territory of Nunavut is Canada’s largest territory. Quebec is Canada’s largest province by land mass at 1,356,128 km^2 or 527,079 mi^2 or 335,210,069 acre. Quebec makes up approximately 15.4% of Canada’s entire area and has a water area of 176,928 km^2 or 68,312 mi^2 or 43,719,860 acres.
Quebec Borders
Quebec is bordered to the west by land by Ontario and shares maritime borders with the territory of Nunavut and the provinces of Prince Edward Island and Nova Scotia. Quebec is also bordered by the following US States: Maine, New Hampshire, Vermont, and New York.
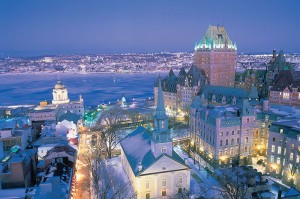 Quebec’s Largest City
Quebec’s largest city is Montreal which has a population of 3,824,221. The next largest city in province of Quebec is Quebec City which only has a population of 765,706. Montreal was originally called the City of Mary and is Quebec’s financial, industrial, technical, cultural, and commercial hub. As Canada’s Cultural Capital, Montreal leads the country in cultural efforts in the classical arts while hosting cultural and social festivities. Montreal’s hockey team, the Montreal Canadiens, has won 24 Stanley Cup Championships, the most of any NHL team.
Quebec Federal Representation
Quebec holds 75 of the 308 House of Commons seats making up 24.4% of the total.
Quebec holds 24 of the 105 Senate Seats making up 22.9% of the total.
Quebec Demographics
Ethnic Origins
- Canadian - pop. 4,474,115 (60.1%)
- French - pop. 2,151,655 (28.9%)
- Irish - pop. 406,085 (5.5%)
- Italian - pop. 299,655 (4%)
- English - pop. 245,155 (3.3%)
- North American Indian - pop. 219,815 (3%)
- Scottish - pop. 202,515 (2.7%)
- Québécois - pop. 140,075 (1.9%)
- German - pop. 131,795 (1.8%)
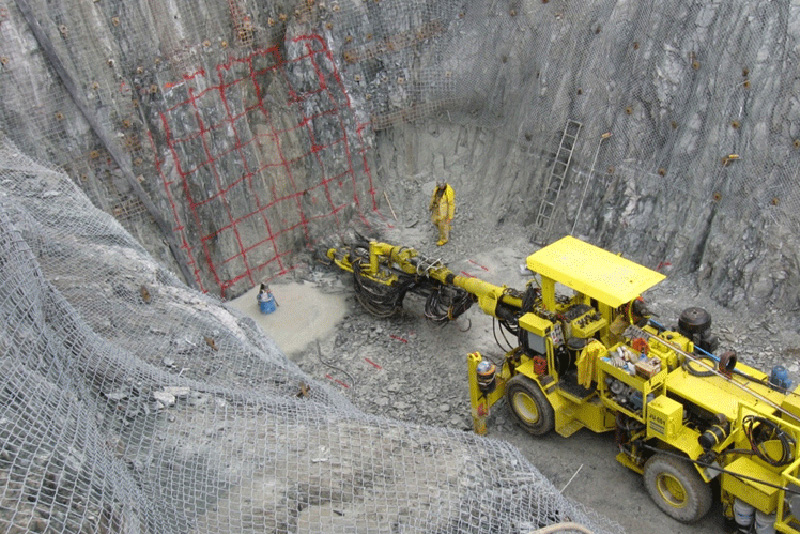 Quebec Economic Statistics
Quebec’s economy makes up approximately 20% of the total gross domestic product of Canada at $320 billion making it the second largest contributor to Canada’s total gross domestic product. The economy has primarily been driven by it’s abundance of natural resources making it a popular destination in the mining sector. Recently Quebec has been shifting towards the services and knowledge sectors focusing more on technology and the sciences.
Quebec Historical Population Statistics
| Year | Population |
| 1851 | 892,061 |
| 1861 | 1,111,566 |
| 1871 | 1,191,516 |
| 1881 | 1,359,027 |
| 1891 | 1,488,535 |
| 1901 | 1,648,898 |
| 1911 | 2,005,776 |
| 1921 | 2,360,665 |
| 1931 | 2,874,255 |
| 1941 | 3,331,882 |
| 1951 | 4,055,681 |
| 1956 | 4,628,378 |
| 1961 | 5,259,211 |
| 1966 | 5,780,845 |
| 1971 | 6,027,765 |
| 1976 | 6,234,445 |
| 1981 | 6,438,403 |
| 1986 | 6,532,460 |
| 1991 | 6,895,963 |
| 1996 | 7,138,795 |
| 2001 | 7,237,479 |
| 2006 | 7,546,131 |
| 2011 | 7,903,001 |
Interactive Canadian Province Population Map
Other Resources
To learn more about the population of Quebec, click here
 Saskatchewan Capital
 Nova Scotia Capital
 Manitoba Population
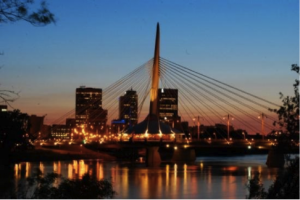 Manitoba Capital
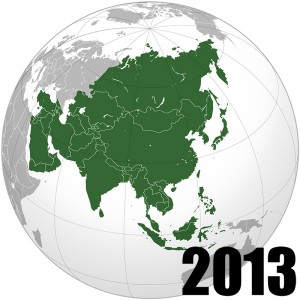
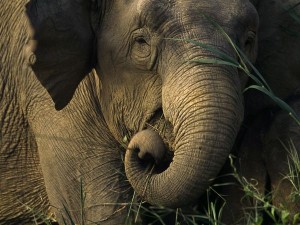 Asian Elephants
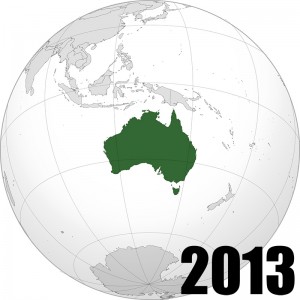
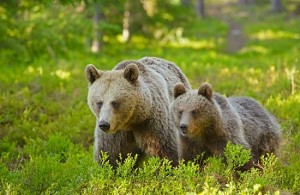
 Australian Wildlife
 Australia’s Largest City
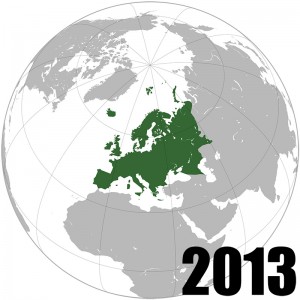
 European Wildlife
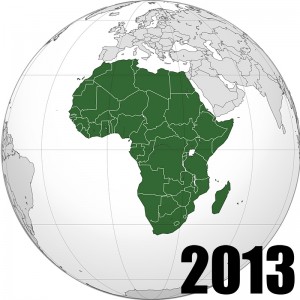
 African Wildlife
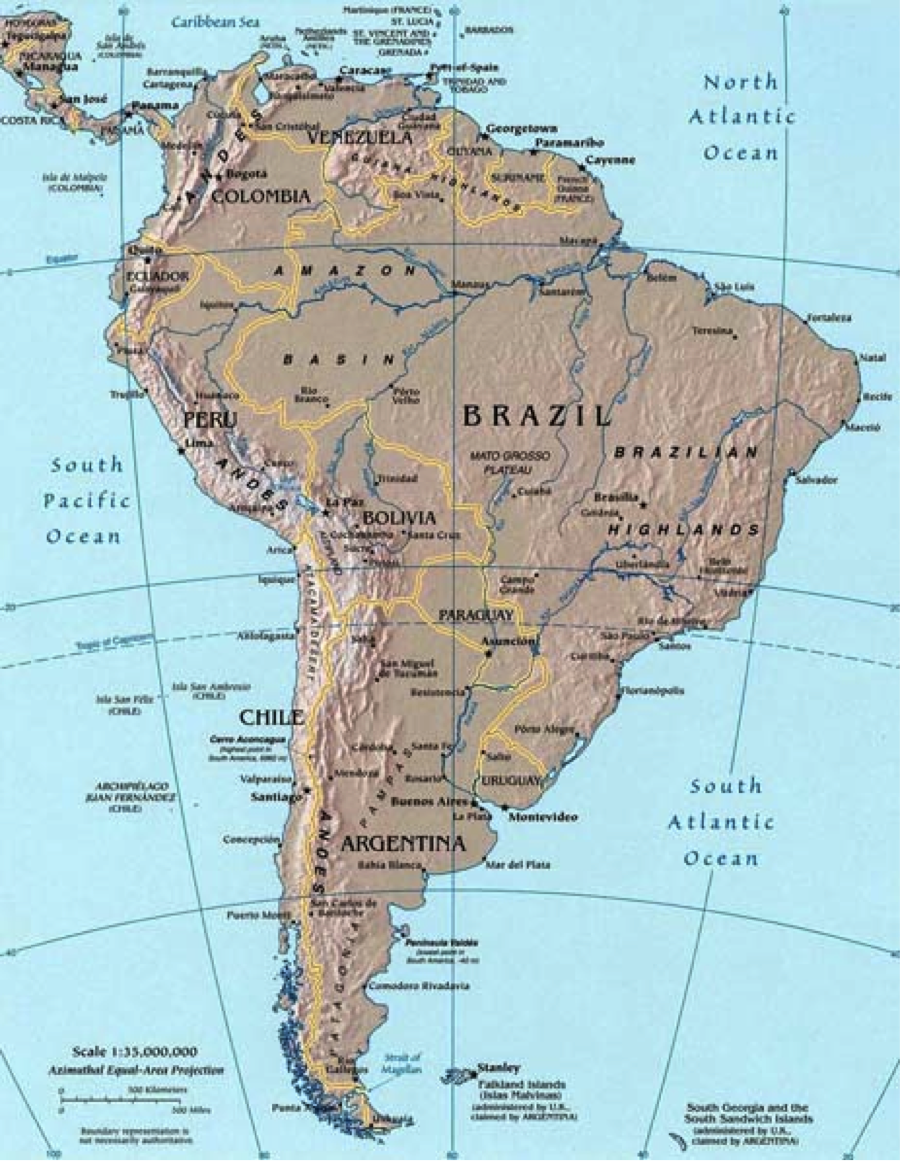
 South America Wildlife
 North America Wildlife